

When a conversation about energy savings begins, much the same suggestions usually come up first: replace the lighting with LEDs, raise the cooling setpoint by one degree, and unplug equipment that is not in use.
None of this is wrong. But it is common to do all of it and still find that next month's bill has hardly changed. From there, people move on to the conclusion that "energy savings never amount to much anyway."
In practice, the order is often reversed. Savings activities were started without first checking what is generating the bill. An electricity bill is not determined by consumption alone. Because it also reflects when and how much was used, the bill can stay the same even when total consumption falls, or go down without any reduction in consumption.
This article sets out the order in which to approach energy savings at the building level. It does not cover equipment replacement or specific products; it focuses on how to read the data.
1. Start by checking how the bill is put together
To decide what to reduce, you need to know which items make up the bill, because each item is reduced in a completely different way.
The bill is made up of two main blocks
Commercial and industrial electricity rates are divided into the demand charge and the energy charge.(KEPCO Cyber Branch electricity rate table)
- Demand charge — the cost of the capacity that is kept available for you to use. It is incurred even when consumption is low
- Energy charge — the kWh actually used, multiplied by the unit rate
The climate and environment charge, the fuel cost adjustment charge, value-added tax, the Electric Power Industry Basis Fund and other items are added to these to arrive at the final amount billed. There is also an item that raises or lowers the demand charge depending on the power factor, which is covered separately below.
KEPCO describes the demand charge as the rate that recovers the fixed costs of supply facilities such as power plants and transmission and distribution lines (in kW), and the energy charge as the rate that recovers variable costs that are proportional to consumption, such as fuel (in kWh).(KEPCO Cyber Branch two-part tariff) The difference in units matters. Reducing kWh and reducing kW are two different jobs.
Many people think only of the energy charge when they work on savings. Yet in some buildings the demand charge accounts for a considerable share. In that case, activities that reduce consumption alone do not produce a change anyone can feel.
Unit rates and the criteria for tariff classes are revised, so this article does not state any unit rates. For an actual review, please check KEPCO's latest rate table. Rate tables by year are also available on the Public Data Portal.(Public Data Portal: KEPCO electricity rate tables by year)
Items to find on the bill first
The first task is to take the bills for the last 12 months and copy the items below into a table. Every later decision depends on this table.
| Item | Meaning | Why it is checked |
|---|---|---|
| Tariff class | General Service (A) I, (A) II, (B), etc. | This determines whether time-of-use rates apply |
| Contract demand (kW) | The maximum power contracted with KEPCO | Used to judge whether it is being exceeded and whether there is room to adjust it |
| Billing demand (kW) | The value actually used to calculate the demand charge | If it differs from the current month's peak demand, a past peak is being applied |
| Current month's peak demand (kW) | The highest of that month's 15-minute intervals | Used to see the peak trend and the seasonal variation |
| Consumption by time period (kWh) | Split into off-peak, mid-peak and on-peak | Used to judge whether any load can be shifted |
| Power factor | Lagging and leading power factor, and the amount added or deducted | Used to check whether a surcharge is being applied |
| Meter reading date | The reference date of the billing period | Used to check whether it is out of step with the calendar month |
Also calculate, month by month, what percentage of the amount billed comes from the demand charge and from the energy charge. If the demand charge share is high in many months, peak management is the first thing to look at; if the energy charge share is high, look first at the base load and at shifting load between time periods.
The demand charge is decided by the moment of highest use
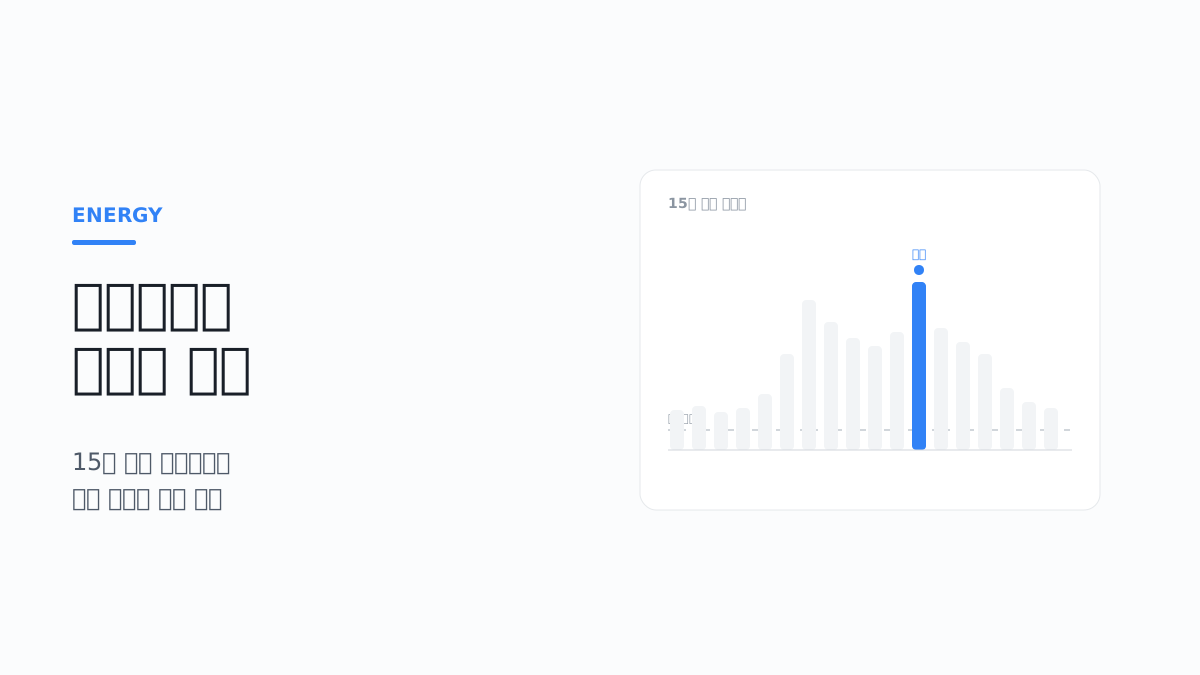
The key concept in calculating the demand charge is peak demand. If you use little electricity all month and then use a lot just once, that moment is reflected in the demand charge.
Demand is measured as average power over 15-minute intervals. KEPCO's Terms and Conditions for Electricity Supply (기본공급약관) define peak demand as "the power accumulated and calculated in 15-minute units by the watt-hour meter."(KEPCO Terms and Conditions for Electricity Supply, Chapter 1 General Provisions) A day is divided into 96 intervals, which gives about 2,880 intervals in a month. The highest of these becomes that month's peak demand.
The value used to calculate the demand charge is the billing demand, and the rules set by Article 68 of the terms are as follows.(KEPCO Terms and Conditions for Electricity Supply, Chapter 8 Calculation and Payment of Charges)
| Category | Billing demand |
|---|---|
| Customers with a watt-hour meter that measures peak demand | The highest of the peak demand values for December, January and February, for July, August and September, and for the current month, within the preceding 12 months including the month of the meter reading |
| Where the above value is less than 30% of the contract demand | 30% of the contract demand |
| Other customers | The contract demand |
For customers on time-of-use rates, the value used is the higher of the peak demand in the mid-peak and on-peak periods, and KEPCO states that peak demand on public holidays is metered as off-peak.(KEPCO Cyber Branch electricity rate table (industrial)) A peak that occurs late at night or on a public holiday does not carry the same weight in the bill as one that occurs during the day on a weekday.
One conclusion follows from this structure.
A single peak in summer or winter sets the demand charge for the following year. A value recorded over 15 minutes on one day in August follows you through to the bill for July of the next year. A peak in spring or autumn, by contrast, is reflected only when that month's value exceeds the existing maximum, and only in that month's bill.
In numbers, it looks like this. The values below are examples for illustration.
| Situation (example) | Value |
|---|---|
| Peak demand in August | 420kW |
| Current month's peak demand in October | 300kW |
| Billing demand on the October bill | 420kW (August falls within the preceding 12 months) |
| If the August peak had been held to 380kW | The difference of 40kW multiplied by the demand charge unit rate is saved every month until a higher value occurs again |
This is why peak management should be concentrated in July to September and December to February. A high value recorded once in these six months cannot be undone, however well the rest of the period is managed. If the billing demand on your bill is higher than the current month's peak demand, start by finding out in which month that value occurred.
What this means in practice is clear. The habit of turning on all the cooling units at once in the morning, and patterns in which electric heaters and air handling units run at the same time, affect the bill directly. Even with the same total consumption, simply spreading out what turns on at the same time can change the bill.
Check that the contract demand matches actual use
Contract demand is the maximum power contracted with KEPCO. Its effect on the bill depends on which row of the table above applies to you.
| Situation | Effect of an excessive contract demand | Direction to review |
|---|---|---|
| Customers without a peak demand meter | The demand charge is applied to the whole contract demand | Check that the contract demand is appropriate for the installed equipment |
| A peak demand meter is installed and the maximum is 30% or more of the contract demand | No direct effect, because the demand charge is based on the actual peak | Peak management takes priority over the contract demand |
| A peak demand meter is installed and the maximum is less than 30% of the contract demand | The demand charge is applied to unused capacity (the 30% floor) | Discuss a reduction of the contract demand with KEPCO |
The statement that "a larger contract demand means a higher demand charge" is true only in the first and third cases. Most buildings with a peak demand meter fall into the second case, so lowering the peak reaches the bill where lowering the contract demand does not.
Conversely, if the contract demand is too small, an excess-use surcharge is added. When the peak demand of a customer whose billing demand is based on peak demand exceeds the contract demand, a multiplier ranging from 150% (excess of less than 20%) to 400% (excess of 60% or more), depending on the excess ratio (excess power ÷ contract demand), is applied to the excess power multiplied by the demand charge unit rate. In the first month of excess the customer is given advance notice of the charge, and it is billed from the second month.(KEPCO Terms and Conditions for Electricity Supply, Chapter 8, Article 67-3)
The check itself is simple. Place the monthly peak demand for the last 12 months alongside the contract demand and calculate the ratio. If it stays below 30%, consider a reduction; if there are months in which it came close to or exceeded the contract demand, consider peak management or an increase in capacity.
There is something to confirm before making an adjustment. In principle, contract demand based on transformer facilities is set as the sum of the rated capacities of the primary transformers that receive electricity from KEPCO.(KEPCO Terms and Conditions for Electricity Supply, Chapter 3, Article 20) It may not be something that can be done by changing paperwork alone, and costs may arise when you reduce it and later increase it again. Please make the decision after reviewing it alongside tenancy plans and equipment expansion schedules and consulting the KEPCO branch office with jurisdiction.
The unit rate differs by time period
Where a time-of-use tariff applies, the charge for the same 1kWh depends on when it was used. Higher unit rates are applied in the seasons and time periods when electricity consumption is concentrated, and lower unit rates at other times.
Time periods are divided into off-peak, mid-peak and on-peak, and the unit rates and periods vary by season (summer June to August, spring and autumn March to May and September to October, winter November to February).(KEPCO Cyber Branch seasonal and time-of-use differential rates)
First check whether your building is covered. For General Service, the position is as follows. The classification of tariff classes is in Article 57 of the terms, and the classification of rates is in Article 67.(KEPCO Terms and Conditions for Electricity Supply, Chapter 7 Tariff Classes, Chapter 8 Calculation and Payment of Charges)
| Tariff class | Eligibility | Rate structure |
|---|---|---|
| General Service (A) I | Contract demand of 4kW or more and less than 300kW, low voltage | Seasonal |
| General Service (A) II | Contract demand of less than 300kW, high voltage | Seasonal and time-of-use |
| General Service (B) | Contract demand of 300kW or more | Seasonal and time-of-use |
If only seasonal rates apply to your building, moving the time of use does not change the energy charge. In that case, shifting load between time periods is meaningful only for spreading out the peak.
The time periods changed in 2026. Under the reform plan released by the Ministry of Climate, Energy and Environment (기후에너지환경부) and KEPCO on March 13, 2026, for weekdays in spring, summer and autumn, 11:00 to 12:00 and 13:00 to 15:00 were changed from on-peak to mid-peak, and 18:00 to 21:00 was changed from mid-peak to on-peak. The whole period from 09:00 to 15:00 is now mid-peak. A separate set of time periods applies in winter. Industrial Service (B) is subject to the change from April 16, and General Service (A) II, General Service (B), Industrial Service (A) II and Educational Service (B) from June 1.(Ministry of Climate, Energy and Environment: release of the reform plan for the seasonal and time-of-use electricity rate system)
In building operation, this change shows up in two ways.
- The cooling load from 11:00 to 15:00 now falls in a lower-rate period than before. If you have an operating schedule designed to avoid the midday on-peak period, it needs to be reviewed again
- The evening hours from 18:00 to 21:00 have become the most expensive period. Stores open at night, air conditioning that runs into the evening, and electric vehicle charging around the end of the working day all fall in it
It was also announced that, from June 2026, General Service (A) II customers can choose a flat rate instead of time-of-use rates, and that for the bills from June through November the amounts calculated under both methods are shown together on the bill and the more favorable one is applied without a separate application.(Korea Policy Briefing: wider choice of electricity rates from June) If this applies to your building, collect the two amounts on the bills for this period and use them as the basis for your later choice.
The rate tables and time period tables on the KEPCO Cyber Branch cited in this article are posted as of the version effective November 9, 2023 (checked in October 2026), and do not reflect the reform above. We were also unable to confirm whether the articles of the terms on the same site have been amended since. Please check the time periods and unit rates actually applied, and the current articles of the terms, on KEPCO ON or with the branch office with jurisdiction.
The Korea Energy Economics Institute (에너지경제연구원) publishes a research report on the structure of time-of-use tariffs and directions for improving them, which is a useful reference for understanding the background to the system.(Korea Energy Economics Institute: study on improving time-of-use tariffs)
The existence of a time period structure points to one direction for savings. The bill goes down simply by moving the time of use. The loads concerned are those whose timing can be adjusted, such as preheating, thermal storage, charging and batch work.
Check whether the optional rate matches your usage pattern
General Service (A) customers supplied at high voltage or above can choose between the Option (I) and (II) rates, and General Service (B) customers between the Option (I), (II) and (III) rates. These are rate tables in which the relative sizes of the demand charge and the energy charge differ.(KEPCO Cyber Branch optional rates by load factor)
| Optional rate | Structure | Favorable condition according to KEPCO |
|---|---|---|
| Option (I) | Low demand charge, high energy charge | Hours of electricity use of 200 hours or less per month |
| Option (II) | Intermediate | More than 200 hours and up to 500 hours per month |
| Option (III) | High demand charge, low energy charge | More than 500 hours per month |
Hours of electricity use can be estimated by dividing monthly consumption (kWh) by the billing demand (kW). The optional rate chosen when the building was first occupied sometimes no longer matches current operating hours, so calculate this for 12 months. Once chosen, a rate can in principle be changed only after one year, so it is safer to decide after the savings tasks have been carried out and the pattern has changed.
Check for surcharges caused by the power factor
The power factor is a route by which the demand charge increases regardless of consumption or peak. The terms require customers to keep the power factor of all their equipment at a lagging power factor of 90% or more, and charges are increased or reduced as follows for customers with a watt-hour meter that measures reactive power (General Service, Industrial Service and others with a low-voltage contract demand of 20kW or more, or at high voltage or above).(KEPCO Terms and Conditions for Electricity Supply, Chapter 5, Articles 41 to 43)
| Time period | Applies to | Reference | Addition or reduction |
|---|---|---|---|
| 09:00 to 23:00 | Lagging power factor | Average of 90% | 0.2% of the demand charge added for each 1% below (down to 60%), 0.2% deducted for each 1% above (up to 95%) |
| 23:00 to 09:00 the next day | Leading power factor | Average of 95% | 0.2% of the demand charge added for each 1% below |
When a surcharge arises, advance notice is given in the first month and it is billed from the second month.
The part buildings often miss is the night. If capacitors installed to suit the daytime load remain switched in at night when the load has fallen, the power factor becomes leading. If your bill shows an additional amount related to the power factor, check together with the electrical safety manager whether the capacitors are switched in and out according to the load and whether the automatic power factor controller is operating normally. This is work on the power receiving equipment, so it is not something facility staff should operate themselves.
2. Secure the data and look at the patterns
Once you understand the rate structure, the next step is the actual data. Savings made by feel cannot be verified.
Two kinds of data are needed
- Monthly billing data — the demand charge, the energy charge, consumption by load period, and the various adjustment items. Used to understand the rate structure and see the annual trend
- Daily consumption in 15-minute intervals — the values for the 96 intervals in a day. Used to check when the peak occurs and what is running at night
Most of the work of finding savings points is done in the second set of data. Monthly totals alone rarely tell you more than "it went up compared with last month."
B-Saver, which we developed and operate, also handles these two layers together. Monthly charges are stored broken down into the demand charge, energy charge, billed amount, discount and consumption by load period, and daily data is stored as 96 intervals of 15 minutes for pattern analysis.
Decide where to get the data from
There are three main routes for obtaining data, and each gives a different depth of information.
| Route | What you can get | Limitation |
|---|---|---|
| Bills | Monthly charge items and total consumption | No way to see patterns by time of day |
| Data provided by KEPCO | Consumption in 15-minute intervals, totals by load period | Only the whole-building total is provided |
| Installing your own meters | Consumption by zone and by piece of equipment | Requires installation cost and construction work |
In most cases you can start with the second stage alone. With nothing more than whole-building 15-minute data, you can already identify the base load and the timing of the peak.
In terms of order, zone-level metering is something to add "when you need to narrow down which zone is the problem." Fitting meters on every floor and piece of equipment from the outset makes the investment larger, and the numbers simply pile up while you still have no baseline for interpreting the data.
These are the points to check when bringing data into a system.
- Collection interval and delay — whether it is real-time or finalized a day later. If the previous day's data arrives the next morning, same-day response is difficult
- When values are finalized — initial values are sometimes corrected later. Analyzing with uncorrected values gives a different result
- Handling of missing data — you need to decide how to treat intervals lost through communication failures. Filling them with 0 distorts the average
- Meter reading date basis — the billing period is sometimes not the 1st to the last day of the month. The basis has to be aligned for month-to-month comparisons
The last item is a frequent source of problems. If the meter is read on the 15th of each month, "July consumption" runs from June 15 to July 14. Comparing this with July on the calendar puts the seasonal factor out of step.
It is a good idea to load the data for the period before the system was introduced as well, because without something to compare against you cannot say anything about the change after introduction. In B-Saver too, past consumption that cannot be fetched through the API is filled in by CSV or Excel upload, a function that is in fact used often during initial setup.
Convert 15-minute data to kW when reading it
Consumption in 15-minute intervals usually arrives in kWh. The demand used for billing is in kW, so the units have to be aligned before it can be compared with the peak demand on the bill. Since 15 minutes is a quarter of an hour, multiplying the 15-minute consumption by 4 gives the average power for that interval. If 105kWh was used in one interval, the demand is 420kW.
If the data is in a database, two queries complete most of the first analysis. The examples below assume PostgreSQL, with the interval start time and consumption stored in a table usage_15min(measured_at timestamptz, kwh numeric).
-- Top 10 demand intervals in a month
SELECT measured_at AT TIME ZONE 'Asia/Seoul' AS interval_start,
       kwh * 4 AS demand_kw
FROM usage_15min
WHERE measured_at >= '2026-08-01 00:00+09'
  AND measured_at <  '2026-09-01 00:00+09'
ORDER BY kwh DESC
LIMIT 10;
-- Average late-night (01:00 to 05:00) power by date
SELECT (measured_at AT TIME ZONE 'Asia/Seoul')::date AS day,
       round(avg(kwh * 4), 1) AS night_avg_kw
FROM usage_15min
WHERE (measured_at AT TIME ZONE 'Asia/Seoul')::time >= '01:00'
  AND (measured_at AT TIME ZONE 'Asia/Seoul')::time <  '05:00'
GROUP BY 1
ORDER BY 1;
There is a reason for pulling the top 10 rather than a single maximum. If the top intervals are clustered on one day, it was a one-off event; if they are spread across the same time on several days, it is a problem with the operating schedule. The responses are entirely different.
There are three points to watch.
- Values calculated this way may not match the peak demand on the bill exactly. This is because the period based on the meter reading date differs from the calendar month, and intervals on public holidays and in off-peak periods are excluded from the billing demand. If you compare against the bill once and identify the cause of the difference, you can rely on the calculation from then on
- A day on which the number of intervals is not 96 is a day with missing data. Count the records per day before taking averages
- Settle at the collection stage whether the timestamp is the start or the end of the interval, and whether it is Korean time or UTC. If this is off, the peak appears to have been recorded in the wrong time period
Sort out access rights to the data
Bringing consumption data into a system requires things such as contract information, a lookup account and an integration key. If this is handled carelessly, it comes back later as an operational problem.
- Confirm who the electricity contract holder is. In leased buildings, the contract holder is sometimes the building owner or the management company. In that case, obtain the contract holder's consent to data lookup and integration with an external system first
- Do not tie the lookup account to an individual staff member. The integration is cut off along with it when the person in charge changes. Use a shared work account or a dedicated integration key, and document who manages it
- Do not leave API keys and customer numbers in plain text in configuration files or messengers. Keys handed to an outsourced vendor are revoked or reissued when the contract ends
- Set the scope of disclosure for consumption by tenant. Once zone metering is added, a particular tenant's business hours and level of activity become visible. Agree in advance who is shown what, and down to which unit
First thing to look at: consumption at night and on holidays
When you receive 15-minute data, the first thing to check is consumption during the hours when nobody is there: late at night, at weekends and on public holidays.
If this value is close to 0, the building is being managed well. In most buildings, however, the value is higher than expected. This is called the base load.
These are the things that make up the base load.
- Server rooms and communications equipment that run 24 hours a day, and their cooling
- Refrigeration and freezing equipment
- Hot water circulation pumps
- Common-area lighting that is never turned off
- Office equipment in standby
- Air handling units that run at weekends because of incorrect settings
The key here is to separate what can be reduced from what cannot. Server room cooling cannot be turned off, but an air handling unit running at the weekend is very likely a settings problem.
Because the base load accumulates 24 hours a day, 365 days a year, the savings are large. Reducing the base load by 1kW cuts about 8,760kWh a year. In many cases the effect is more certain than that of careful saving during the daytime.
Second thing to look at: when the peak occurred
Find the interval in which that month's peak demand was recorded and check what was happening at that point. Start with the month that produced the billing demand. Look first at the top intervals of the month with the highest value among July to September and December to February in the preceding 12 months.
Once you have found the time, match it against what was turned on then. The things to compare against are the start-up records of the BAS or control system, the facility log, and the schedules for events and construction work. If no control history remains, all you can do at this stage is estimate, so a building with no records should start by writing down operating times.
These are the patterns that are often found.
| Pattern | Situation | Direction of response |
|---|---|---|
| Simultaneous morning start-up | All air handling units turn on at once at the start of the working day | Staggered start-up by zone |
| Post-lunch return peak | Equipment that had been switched off restarts at the same time | Sequential return |
| Afternoons in the hottest period | Rising outdoor temperature coincides with occupancy | Pre-cooling, setpoint management |
| Recurring on a particular day of the week | Coincides with regular work or an event schedule | Adjust the time of the work |
Simultaneous morning start-up is the most common and among the easier to resolve. Leaving a few minutes between units instead of turning on every air handling unit at the same time is sometimes enough to lower the peak noticeably. Occupants are unlikely to notice a difference.
Third thing to look at: share of use by load period
If a time-of-use tariff applies, check how total consumption is divided among the time periods.
If the share in the on-peak period is high, there are two directions to consider.
- Find loads that can be shifted — those whose timing can be adjusted, such as preheating, thermal storage, charging, washing and batch work
- Identify loads that cannot be shifted — lighting and air conditioning that are essential during working hours are not candidates for adjustment
The judgment made here is important. If there is almost no load that can be shifted, the effect to be gained from shifting between time periods is limited. In that case it is better to concentrate on tidying up the base load and spreading out the peak.
Conversely, if there are loads whose timing can be adjusted, such as production equipment or large-scale hot water supply, shifting between time periods alone can make a considerable difference. Since only the operating time is changed and the equipment is not, it costs nothing either.
Fourth thing to look at: day-of-week and seasonal patterns
Overlaying the profiles for weekdays and weekends, and for each season, reveals the anomalies.
- Weekend consumption is not much different from weekdays → a schedule settings problem
- Heating and cooling consumption is high even in the shoulder seasons (spring and autumn) → an automatic changeover settings problem
- Only one particular floor has a different pattern → the equipment or operating practice in that zone needs to be checked
When setting a basis for comparison, it is more accurate to view it alongside the outdoor temperature. Even if consumption rose compared with the previous year, the interpretation changes if that summer was hotter.
3. Turn the points you found into tasks and prioritize them
When the analysis results are in, turn them into tasks for implementation. Trying to do everything at once at this point usually means nothing gets finished.
Divide them by cost and effect
| Category | Examples | Characteristics |
|---|---|---|
| Settings changes | Schedule adjustment, setpoint management, staggered start-up | Almost no cost and can be applied immediately |
| Operational improvements | Management rules by zone, check procedures on leaving | Depend on people's habits, so sustaining them is the challenge |
| Introducing automation | Sensor-based control, schedule automation | Requires initial investment; the effect is maintained |
| Equipment replacement | High-efficiency equipment, inverters | Large investment; the payback period needs to be reviewed |
| Contract adjustment | Changing the contract demand, reviewing the rate plan | The usage pattern must be confirmed first |
It is generally advantageous to work down from the top. Settings changes and operational improvements can be verified without spending money, and the data they produce becomes the basis for later investment decisions.
Starting with equipment replacement causes problems. The investment is large, and it is hard to reverse before the effect has been verified.
Choose the first task according to what you saw in the data
Even within the same category, what to do first differs from building to building. Apply what you confirmed in the earlier steps to the table below and the first task is settled.
| What you confirmed in the data | What to do first | Bill item that goes down |
|---|---|---|
| Late-night and holiday power is a considerable part of the daytime level | Investigate what makes up the base load, correct schedule errors | Energy charge |
| The billing demand is consistently higher than the current month's peak demand | Identify the cause of the peak in the month that produced that value, stagger start-up in summer and winter | Demand charge |
| The top demand intervals recur at the same time every day | Adjust the start-up order and intervals | Demand charge |
| The share of use in the on-peak period is high and there is load that can be shifted | Shift the operating time | Energy charge |
| Peak demand stays below 30% of the contract demand | Discuss a reduction of the contract demand | Demand charge |
| There are months in which peak demand exceeded the contract demand | Suppress the peak; if that is not possible, consider an increase in capacity | Excess-use surcharge |
| A power factor surcharge is being billed | Inspect the capacitors and the automatic power factor controller | The addition to the demand charge |
| Hours of electricity use do not match the optional rate criteria | Consider changing the optional rate | The split between the demand charge and the energy charge |
Choose only one or two at a time. If several tasks are started in the same month, you cannot tell which one produced the effect even when the bill changes.
Write tasks in a form whose effect can be measured
"Save on lighting" does not qualify as a task, because it cannot be measured.
A task must include the following.
- The target zone or equipment
- What will be changed
- When it will be applied
- The metric to measure and the basis for comparison
- When the judgment will be made
For example, written as "stagger the start-up times of the third-floor air handling units by 5 minutes per zone, and compare daily peak demand for 4 weeks after application with the preceding 4 weeks and the same period of the previous year," the effect can be verified.
Written as a table, a single task takes the following shape. The values are examples.
| Item | Example entry |
|---|---|
| Target | 6 air handling units on the third floor |
| Change | Change the all-at-once start-up at 08:30 to sequential start-up at 5-minute intervals from 08:10 |
| When applied | Monday of the first week of July |
| Metric | Daily maximum demand (kW) in the 08:00 to 09:30 window on weekdays |
| Basis for comparison | Weekdays in the preceding 4 weeks; the fourth floor (not applied) in the same period |
| When judged | 4 weeks after application |
| Rollback condition | If there are 3 or more indoor temperature complaints in a week, shorten the interval and test again |
| Owner | One person in the facilities team |
It is important to write down the rollback condition in advance. Savings tasks are often stopped not because they have no effect but because of complaints about discomfort. Unless you have decided what level of discomfort calls for an adjustment and what level is to be accepted, the whole task reverts to how things were at the first complaint.
Apply automation only to what recurs
Savings activities that people have to keep in mind every time do not last. They are kept up for the first few weeks and fade once things get busy.
A rule that recurs is a candidate for automation.
- Automatic lights-off outside working hours
- Stopping heating and cooling in unoccupied spaces
- Day-of-week and public holiday schedules
- Upper and lower limits on setpoints
- Temporarily stopping non-essential loads when a peak is imminent
When designing automation, exception handling must be defined along with it. If the lights go off while someone is working late, or server room cooling is caught by a power-saving rule and stops, the system itself becomes unusable. Matters such as false occupancy detections and the priority of manual operation are covered separately in Why Is the Meeting Room Air Conditioner Still Running? — Designing Occupancy-Based Space Control.
Peak control, the last item on the list, has more demanding conditions than the other rules.
- The decision has to be made before the interval ends. Demand is a 15-minute average, so acting on a finalized value after the interval has ended is already too late. Calculating a projection from cumulative consumption within the interval requires on-site metering that delivers values minute by minute. Data that arrives finalized the next day allows only after-the-fact analysis
- Agree in advance on what is stopped and in what order. Settle with tenants and operating departments what may be stopped and for how many minutes. Server rooms, refrigeration and freezing, and medical and safety equipment are excluded
- Make sure restarting does not create a new peak. If the stopped loads all come back at the start of the next interval, that interval becomes the peak. Design the return to be sequential as well
- Reset the target value at the start of the season. The maximum values in July to September and December to February govern the year, so set the target on the basis of the previous year's results before entering these periods
4. Build a measurement framework and keep watching
Savings do not end with a single project. As people change, equipment changes and the seasons change, the patterns change too.
Decide what to check regularly
| Frequency | Items to check |
|---|---|
| Daily | The previous day's peak demand, any base load anomaly |
| Weekly | Changes in day-of-week patterns, whether automation rules are working |
| Monthly | Billed amounts against the estimate, comparison with the same month of the previous year |
| Quarterly | Verification of the effect of each task, identification of new tasks |
| Annually | Appropriateness of the contract demand, review of the rate plan |
Receive anomalies as alerts
An arrangement in which someone opens the dashboard every day is hard to sustain. It is better to set things up so that an alert goes out when a threshold is crossed.
- The base load moves outside its usual range
- Peak demand approaches the threshold
- Consumption in a particular zone changes sharply
- Metering data stops arriving
The last item is more important than it might seem. If data is not coming in and nobody knows, that period is empty when you try to analyze it a few weeks later. How to detect and recover from communication loss in field equipment is covered in Operating IoT Systems Installed in the Field — Disconnections, State Mismatch, and Remote Management.
These are the points to observe when setting alert thresholds.
- Take the threshold values from the building's own record. For the base load, use the range for the same day of the week and time of day over the last 4 weeks; for peak demand, use the current billing demand. For example, split it into a caution when a certain percentage of the billing demand is reached and a warning when it is exceeded. The percentage is adjusted building by building in the course of operation
- Send only alerts that the recipient can act on. An imminent-peak alert goes to someone who can reduce load on site, and a projected-bill alert goes to the person in charge of the budget. If everything is sent to everyone, soon nobody reads any of it
- State the action to be taken in each alert. Do not send only "approaching peak demand"; include which loads to reduce and in what order
Recipient segmentation and alert fatigue are set out in The Point Where Notifications Start Getting Ignored — Designing a Delivery System.
Proving the effect requires a basis for comparison
"Consumption went down compared with last year" is not enough on its own to call it a result of the savings activities. That summer may have been less hot, occupancy may have fallen, or the number of business days may have been different.
These are the variables that need to be adjusted for.
- Outdoor temperature — directly affects the heating and cooling load. Using indicators such as cooling degree days and heating degree days makes comparison easier
- Number of business days and operating hours — the placement of public holidays differs from year to year
- Occupancy and floor area — if the tenancy situation has changed, comparing totals is meaningless
- Equipment changes — check whether there were additions or removals unrelated to the savings activities
- Changes to the rate system — in a year when unit rates or time periods changed, a year-on-year comparison of billed amounts does not hold. This is the case when load periods are adjusted, as in 2026. Judge results first by consumption (kWh) and peak demand (kW) rather than by amount, and convert to amounts by applying the same rate table to both periods
The most practical method is to compare a zone where the change is applied with a zone where it is not, over the same period. If the new rule is applied only to the third floor of the same building and the fourth floor is left as it is, common factors such as outdoor temperature act equally on both, so the difference can be regarded as the effect of the activity.
Applying it to the whole building at once makes this comparison impossible. Confirming it in one zone first and then rolling it out is also better for verification.
Look at rate data and metering data together
KEPCO billing data shows the result for the whole building but does not tell you the cause. Conversely, zone-level metering data shows the cause but is not directly connected to the bill.
Only when the two are viewed together is the connection made that "this equipment in this zone is generating this much of the bill." Investment decisions also become possible only once this connection exists.
When the control history is placed on the same time axis as well, identifying the cause becomes much faster, because you can immediately cross-check which device was turned on in the interval where the peak was recorded, by whose operation, and whether manually or automatically. Turning this cross-checking into an on-screen lookup was also the reason we built B-Saver with device control and power data in a single system.
The monthly check also includes verification of the bill. Match the consumption and peak demand calculated from the 15-minute data against the values on the bill, and if the difference is large, suspect missing collection or an error in the period basis first. If this cross-check is skipped, you end up building months of analysis on incorrect data.
5. Frequently asked questions
How much of a saving can be expected
It varies very widely depending on the state of the building. In a building that is already well managed there is not much room, while in a building where not even schedules have been set, settings changes alone produce a noticeable change.
It is best to treat with caution any proposal that presents specific figures up front. The possible extent of savings cannot be known without looking at the current usage pattern. A grounded estimate becomes possible only after 1 to 2 months of 15-minute data have been reviewed.
Is there an effect without replacing equipment
Yes. But the limits are also clear.
What settings and operational improvements can reduce is load that was running at times when it was not needed: schedule errors, weekend operation, excessive setpoints and the like. Once this area has been tidied up, equipment efficiency itself becomes the constraint from then on.
In terms of order, it is right to tidy up settings and operations first. Only then can the effect of equipment replacement be measured accurately. If both are done at the same time, it is not possible to tell which contributed.
Can it be applied to existing equipment
What matters is whether it can be controlled, rather than the equipment itself. These are the items to check.
- Whether there are remote control contacts or a communication port
- Whether an existing BAS (building automation system) is installed and can be integrated
- Whether control of individual devices is needed, or zone-level control is sufficient
Even with old equipment that has no communication function, integration by adding a control module is sometimes possible. However, this involves electrical work, so an on-site check must come first.
How much data needs to be collected before analysis is possible
At least one month is needed to see patterns, and a year's worth to take seasonal factors into account.
However, the base load can be checked with just a few days of data. Looking at the 15-minute data for a single weekend day shows at once how much is going out during the hours when nobody is there. There is no reason to put off analysis for a year.
6. Checklist before starting
Understanding the rate structure
- Have you confirmed the tariff class and the contract demand?
- Have you confirmed whether you are a customer with a watt-hour meter that measures peak demand?
- Have you calculated the shares of the demand charge and the energy charge from the bills for the last 12 months?
- Have you confirmed whether a time-of-use tariff applies, and the time periods currently in force?
- Have you checked the peak demand trend for the last 12 months?
- Have you confirmed which month's peak the current billing demand comes from?
- Have you checked whether there are months in which peak demand was less than 30% of the contract demand or exceeded the contract demand?
- Have you checked whether a power factor surcharge is being billed?
- Have you calculated whether the optional rate matches current hours of electricity use?
Securing the data
- Have you obtained the monthly billing data?
- Have you obtained the daily consumption data in 15-minute intervals?
- Have you identified the electricity contract holder and the person authorized to look up the data, and obtained consent?
- Have you decided who is responsible for managing the lookup account and the integration key?
- Have you settled the timestamp basis (interval start or end, time zone) and the meter reading date basis?
- Have you compared the values calculated from the 15-minute data with the values on the bill?
- Have you set the data retention period and the update interval?
- Have you decided whether zone-level metering is needed?
Analysis
- Have you measured the base load level at night and on holidays?
- Have you identified the components of the base load item by item?
- Have you identified when peak demand occurred and why?
- Have you checked for anomalies in day-of-week and seasonal patterns?
- Have you reflected outdoor temperature in the basis for comparison?
Implementation
- Have you classified the tasks by cost and effect?
- Does each task have a metric and a basis for comparison?
- Does each task have a rollback condition and an owner?
- Have you set a peak target value before entering July to September and December to February?
- Have you defined what is to be automated and the exception rules?
- Have you set the regular check frequency and the person responsible?
- Have you set the alert thresholds for anomalies?
Closing
The most common mistake in energy savings is acting before measuring. If you start without knowing what is generating the bill, you cannot even judge whether there was an effect.
The order is simple. Check the rate structure, secure the data, find the anomalies in the patterns, try changing the things that cost nothing first, and move on to automation and investment once the effect is confirmed.
We have been building systems that link the spaces and devices in buildings and facilities, analyze usage patterns and connect them through to control. If you are considering building energy management, we suggest starting by checking together what data you can currently obtain. The bills for the last 12 months are enough to begin with. Please get in touch through Contact.
Related articles
- Why Is the Meeting Room Air Conditioner Still Running? — Designing Occupancy-Based Space Control
- Operating IoT Systems Installed in the Field — Disconnections, State Mismatch, and Remote Management
- The Point Where Notifications Start Getting Ignored — Designing a Delivery System
References
- KEPCO Cyber Branch, Electricity Rate Table (General Service A/B) (in Korean) — https://cyber.kepco.co.kr/ckepco/front/jsp/CY/E/E/CYEEHP00102.jsp
- KEPCO Cyber Branch, Electricity Rate Table (Industrial Service A/B) (in Korean) — https://cyber.kepco.co.kr/ckepco/front/jsp/CY/E/E/CYEEHP00103.jsp
- KEPCO Cyber Branch, Two-Part Tariff (in Korean) — https://cyber.kepco.co.kr/ckepco/front/jsp/CY/H/C/CYHCHP00202.jsp
- KEPCO Cyber Branch, Main Electricity Rate Systems (Demand Charge Linked to Summer and Winter Peak Demand) (in Korean) — https://cyber.kepco.co.kr/ckepco/front/jsp/CY/H/C/CYHCHP00203.jsp
- KEPCO Cyber Branch, Seasonal and Time-of-Use Differential Rates (in Korean) — https://cyber.kepco.co.kr/ckepco/front/jsp/CY/H/C/CYHCHP00204.jsp
- KEPCO Cyber Branch, Optional Rates by Load Factor (in Korean) — https://cyber.kepco.co.kr/ckepco/front/jsp/CY/H/C/CYHCHP00205.jsp
- KEPCO, Terms and Conditions for Electricity Supply, Chapter 1 General Provisions (Definition of Peak Demand) (in Korean) — https://cyber.kepco.co.kr/ckepco/front/jsp/CY/D/C/CYDCHP00101.jsp
- KEPCO, Terms and Conditions for Electricity Supply, Chapter 3 Standards for Electricity Use Contracts (Determination of Contract Demand) (in Korean) — https://cyber.kepco.co.kr/ckepco/front/jsp/CY/D/C/CYDCHP00103.jsp
- KEPCO, Terms and Conditions for Electricity Supply, Chapter 5 Cooperation in the Use of Electricity (Power Factor) (in Korean) — https://cyber.kepco.co.kr/ckepco/front/jsp/CY/D/C/CYDCHP00105.jsp
- KEPCO, Terms and Conditions for Electricity Supply, Chapter 7 Tariff Classes (in Korean) — https://cyber.kepco.co.kr/ckepco/front/jsp/CY/D/C/CYDCHP00107.jsp
- KEPCO, Terms and Conditions for Electricity Supply, Chapter 8 Calculation and Payment of Charges (Billing Demand, Excess-Use Surcharge) (in Korean) — https://cyber.kepco.co.kr/ckepco/front/jsp/CY/D/C/CYDCHP00108.jsp
- Ministry of Climate, Energy and Environment, "Release of the Reform Plan for the Seasonal and Time-of-Use Electricity Rate System" (March 13, 2026) (in Korean) — https://www.mcee.go.kr/home/web/board/read.do?menuId=10598&boardMasterId=939&boardCategoryId=&boardId=1849370
- Korea Policy Briefing, "Easing the Electricity Bill Burden on the Self-Employed: Wider Choice of Electricity Rates from June" (May 27, 2026) (in Korean) — https://www.korea.kr/news/policyNewsView.do?newsId=148965108
- Public Data Portal, KEPCO Electricity Rate Tables by Year (in Korean) — https://www.data.go.kr/data/15090576/fileData.do
- Korea Energy Economics Institute, "A Study on Improving Time-of-Use Tariffs" (in Korean) — https://www.keei.re.kr/keei/download/KIP1903.pdf