B-Saver

Case Summary
Client
DWK Partners (in-house solution)
Industry
Building energy management, IoT space control
Period
April 2025 to present (in operation)
Challenge
Device control and power usage lived in different systems, so cross-checking the two was left to people
Key features
Space-level device control, scenario automation, QR temporary access, power usage analysis, notification center
Outcome
More than 200 IoT devices controlled from a single dashboard, with control history and usage changes shown on the same screen
1. About the Service
B-Saver is a building energy saving solution that we developed and operate ourselves.
- Product line: B-Saver for buildings and F-Saver for a separate use case, developed on the same foundation
- Delivery model: Cloud SaaS dashboard + on-site kiosk and mobile app
- Control scope: More than 200 IoT devices, including lighting, switches, and heating and cooling
- Operating status: Development began in April 2025; operation and feature additions have continued to the present
2. Background
To cut a building's energy costs, you need to know two things at the same time: which devices are on in which spaces right now, and how much electricity is being used as a result. On site, however, these two pieces of information live apart. Device control happens in each manufacturer's app, while power usage is checked on Korea Electric Power Corporation (KEPCO, 한국전력) bills or in a separate metering system. Joining the two is left to the facility manager.
It can be checked, but nobody does it
The problem is that this link depends on human memory. To answer a question like "There was a day last week when the meeting room cooling was left running. How much did power usage spike that day?", someone has to find the control records and the usage data separately and line them up by time. Most sites do not do this work. It takes a long time, and the same work has to be repeated the following month anyway. As a result, energy saving stays at the level of guidelines such as "set cooling to 26 degrees in summer."
Putting both kinds of information in one system
B-Saver is the in-house solution we built to close this gap. Development began in April 2025, and operation and feature additions have continued since then; it now controls more than 200 IoT devices. When device control and power data sit in the same system, the question above stops being a cross-checking task and becomes a screen lookup.
This is also why we built it as our own solution. Energy management systems on the market focus on metering, and smart home platforms focus on control. To handle both, you have to buy two systems and join them, and that point of contact has to be built by hand in the end. We concluded that it was better to design a single system from the start. We are currently developing B-Saver for buildings and F-Saver for a different use case together on the same foundation.
The goal was clear from the beginning: managers should be able to finish control and analysis by moving down from building to floor and from floor to space, without switching between several apps. We added one more condition. Because the manufacturers and types of installed devices differ from building to building, the architecture must not be tied to any particular manufacturer.
In one line When device control and power usage sit in the same system, finding the cause becomes a screen lookup instead of a cross-checking task.
3. Key Features
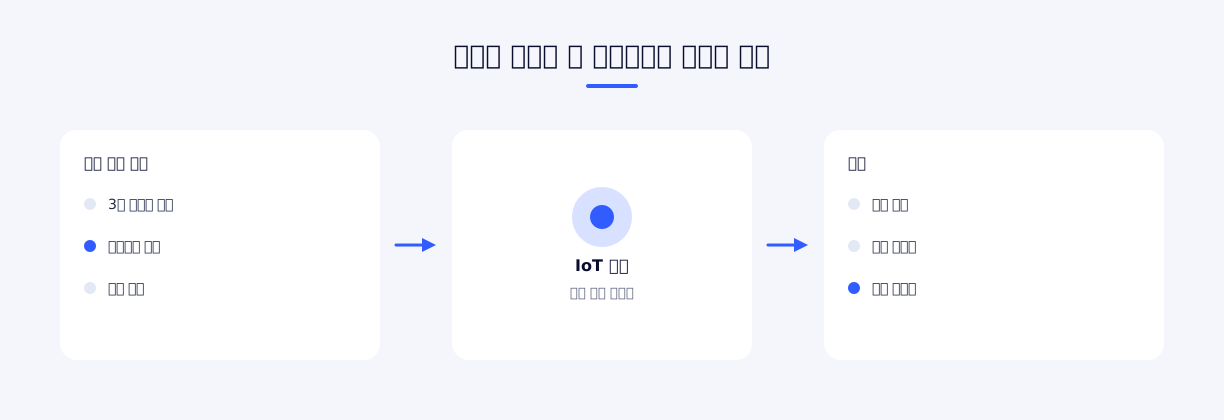
We placed Home Assistant (an open-source IoT hub) as the control layer and built a SaaS management dashboard on top of it. Home Assistant handles thousands of device types as standardized entities, so even if the lighting manufacturer changes, the upper system can control the devices in the same way. B-Saver's role is to map these entities onto the operating units of building, floor, and space.
Why the space is the unit
The point we spent the longest on in the initial design was the base unit of control. Laying out a device list and switching devices on and off one by one is easy to build. But the instruction a building manager actually gives is "Please clear the third-floor meeting room," not "Please turn off lights 12 and 14." If the screens are built around devices, the manager has to translate spaces into device lists in their head, and that translation gets harder as the number of devices grows.
So we made the space the base unit and placed devices under it. What appears first on screen is the space, and devices appear when the space is opened. Thanks to this choice, even with more than 200 devices, the list the manager sees grows only by the number of spaces.
A space-centered data model
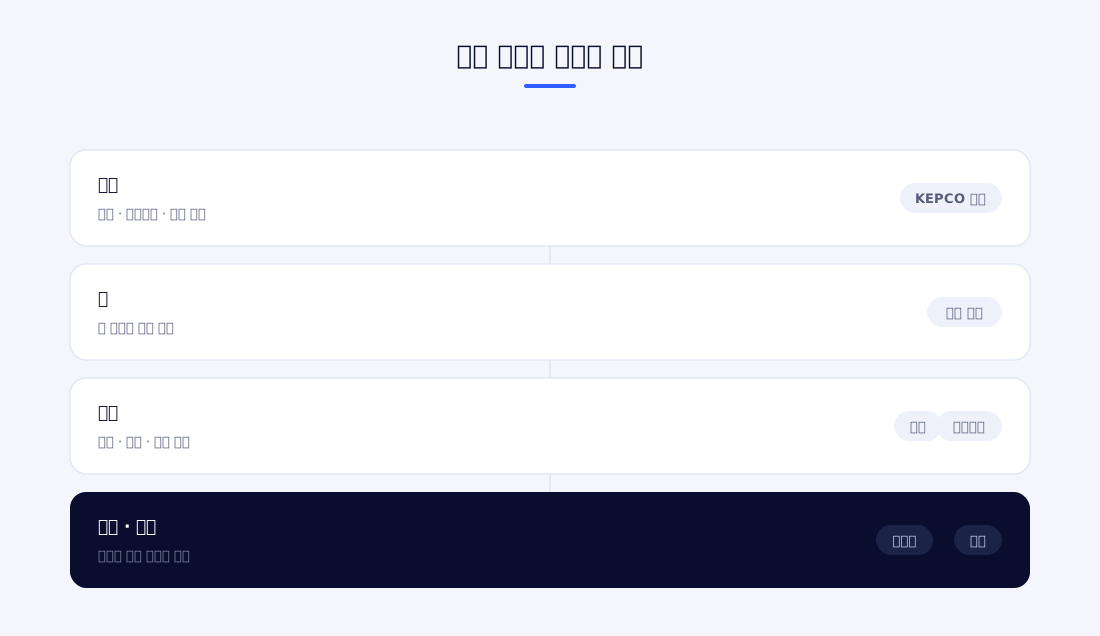
The center of the system is the space, not the device. Under a Building there are Floors, and under a Floor there are Spaces. A space carries information such as its type (office, meeting room, common area), area, and capacity, along with its current state. Because states such as being cleaned, occupied, or in a meeting are managed as status values, the manager can first check what is happening in a space before pressing a control button.
Devices and Sensors are placed in spaces. A device is registered by its Home Assistant entity ID, and its alias, description, firmware information, online status, and last communication time are managed together. Sensors cover temperature, humidity, illuminance, motion, and so on, and they can also be left unassigned without being mapped to a space. This leaves room for equipment that has been installed but has not yet been assigned to a space. Sensor values are accumulated as time series.
Product line and monorepo structure
The repository is organized as a monorepo. B-Saver for buildings, F-Saver for a different use case, and the administrator application exist as separate apps in the same repository, and shared UI components, the gRPC communication core, and the HVAC control contract are split out as packages. Even as products are added, the control protocol and UI rules are managed in one place.
The kiosk and mobile app for on-site operation are kept in a separate repository. The administrator web app, the kiosk web app, and the native Android app share a common database package, and the repository includes a payment terminal (VAN) integration module. Payment terminals often respond late or disconnect midway, so we maintain a technical document that separately sets out the polling approach and exception handling.
Operating screens
The screens are arranged to follow the manager's daily routine. After login, the dashboard opens first. The numbers of total spaces, active spaces, online devices, and sensors are summarized in cards, followed by the distribution by device type and the list of recently controlled devices. If a number looks off here, the manager moves straight to the relevant screen.
The space control screen consists of a building, floor, and space tree and space cards. Tapping a card opens a detail modal, where the manager checks the list of devices and sensors and runs scenarios. The device management screen handles entity registration, placement, and alias editing, and the settings screen covers building and space information, API keys, meter settings, subscription and security, and notification settings.
The energy analysis screen shows monthly and daily usage based on meter data. The control history screen and the notification screen list logs and notifications in chronological order, and the automation screen manages the scenario list and execution status. Finally, a lightweight control page accessed with a QR token sits on a separate path. Because this page opens without login, it is kept completely separate from the other screens.
Power data integration
Power data is integrated with KEPCO meter information. When a meter setting is attached to a building, information such as customer name, address, contract demand, and meter reading date is managed with it, and an external API key is connected to bring in usage. Monthly charges are stored broken down into base charge, energy charge, billed amount, discount amount, and usage by load period. Daily data is stored as an array that divides a day into 96 intervals of 15 minutes, so questions such as "Does a power peak occur during the hours when meeting room use is concentrated?" can be answered with data.
Historical data that cannot be fetched through the API is filled in by uploading CSV and Excel files. Usage from the period before the system was introduced has to be loaded for there to be something to compare against, so this feature is in fact used often during initial setup.
Main features
Space-level device control
Devices are controlled by moving down the building, floor, and space hierarchy. A space card shows the current state together with the connected devices and sensors, and opening the card lets the manager operate individual devices or change the space state in the detail modal. The filter panel narrows the view to spaces that meet specific conditions, so spaces that need action can be found without scanning the whole floor. Because each device shows whether it is online and its last communication time, when a command fails it is possible to tell whether the cause is a communication problem or a configuration problem.
Scenario automation
Multiple device controls are bundled into one scenario and run with a single button. A scenario can be created for a specific space or kept global, and it is given an icon, a color, and a target state. Each action in a scenario can be given an order and a delay, so a procedure such as "turn off the lights, then switch cooling to power-saving mode three seconds later" can be carried over as is. With some devices, a later command is dropped when commands are sent in quick succession, so delayed execution is closer to a required feature than an optional one.
Control history and statistics
Every control action is logged. The log records who ran it, whether it was manual or automatic, and whether it succeeded or failed, and a statistics API aggregates the records. This log serves two purposes. One is tracing the cause when a problem occurs, and the other is checking how much automation has actually contributed. The dashboard shows the automation effect and the average number of control actions as cards.
QR-based temporary access
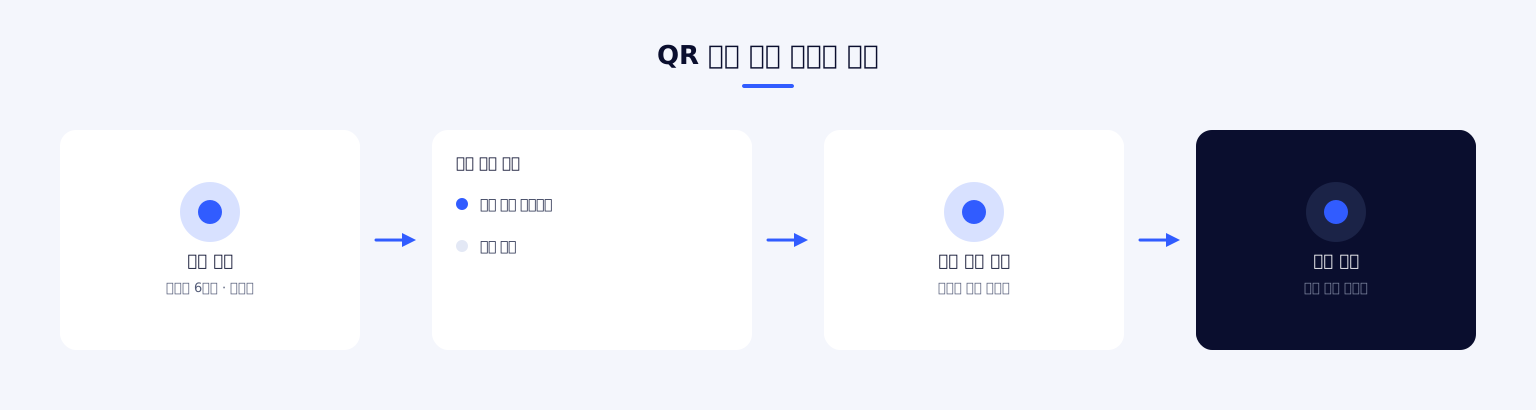
We added QR access for users who cannot be given an account, such as room guests or external contractors. A six-digit code encrypted with AES-256 is issued per space, and a user who enters with that code can run only the permitted scenarios. Because the list of runnable scenarios is attached to the access grant rather than to the space, the scope of permission can differ by recipient even for the same space. When an expiry time is set, the permission disappears automatically after the set period, and the access screen is provided as a lightweight page with only a few buttons, not the full dashboard.
Power usage analysis
Monthly charges and daily usage are queried and synchronized for buildings linked to a meter setting. The dashboard shows the monthly trend and 15-minute interval usage in charts, and it separates usage by load period. Because charge items are stored in detail, it is possible to tell whether a change in the billed amount comes from an increase in usage or from a change of tariff.
Notification center
Notification types such as system, device, security, and billing are distinguished, and the sending history is kept per channel: email, push, SMS, and web. Each user can separately set which notification types and channels to receive, so a facility manager and an accounting manager can be configured to receive only different notifications. Because the sending history is stored separately, when an inquiry comes in that "the notification did not arrive," it is possible to check whether it was never sent or was sent but failed to be delivered.
Authentication and API tokens
In addition to email and password login, sessions and login history are managed in separate tables. Users can view their own session list and sign out of all sessions. When a daemon or backend service calls the API, it uses a separately issued API token rather than a human account, and this token is verified as a JWT. Keeping authentication for people separate from authentication for machines prevents integrations from breaking when accounts are cleaned up after a change of staff.
Separating on-site equipment from management tools
Even within the same system, the screen a manager uses in the office and the screen on equipment installed on site have different requirements. Management screens need high information density, and on-site equipment must be usable by anyone without guidance. So we split the administrator web app, the kiosk, and the mobile app into separate applications while having them share the database package. Screens are built separately to suit their purpose, and the data structure is managed in one place.
Key design decision We set the base unit of control as the space, not the device. Even with more than 200 devices, the list the manager sees grows only by the number of spaces.
4. Outcome
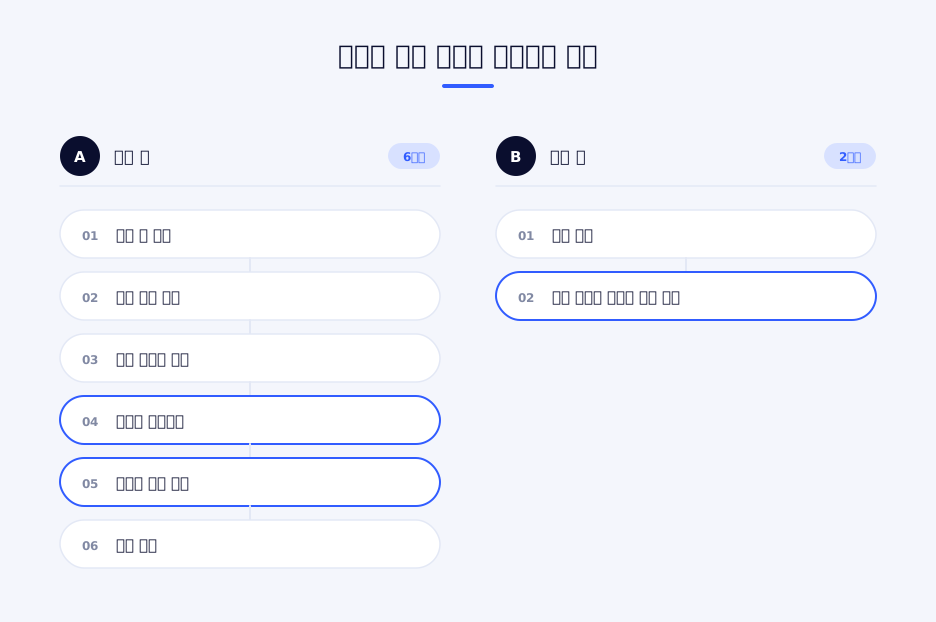
More than 200 IoT devices are controlled from a single dashboard. By placing device control and power data on the same screen, we created an operating environment where control history and changes in usage can be checked together. Work that previously required going back and forth between two systems to cross-check has become a screen lookup.
With QR access, limited control permission can be given to external users without issuing accounts, which makes the architecture applicable to spaces where users change frequently, such as accommodation and shared offices. Because issuance and expiry are handled automatically, no problem arises even if the operator forgets to revoke a permission.
Because the product line is bundled in a monorepo and the control contract is split out as a package, adding a new product reuses the existing control layer and UI rather than starting from scratch. This structure is also what allows B-Saver for buildings and F-Saver to share the same foundation.
On the operations side, keeping control logs and notification sending history is what actually gets used most often. Inquiries such as "the command did not work" or "the notification did not arrive" have to start with reproduction when there is no record, but with a record they end with a single lookup. Deciding where to record the execution result of each feature every time we added one reduced the operating burden.
Operation and feature improvements have continued since April 2025, and we keep expanding the control targets and analysis items to reflect requirements that come from the field.
5. Technical Stack
Web
Built with Next.js 15 App Router, React 19, and TypeScript. The UI uses Tailwind CSS and shadcn/ui components, and charts are drawn with Recharts. It supports switching between dark and light themes and is configured as a PWA so that it can be installed and used like an app on on-site tablets. Korean and English UIs are both provided.
Backend
Authentication and domain APIs are built on Next.js API Routes. User authentication uses NextAuth.js, and machine-to-machine communication uses API tokens + JWT. The database uses Prisma ORM and PostgreSQL, and API input values are validated at runtime with Zod. Code formatting and linting are unified under Biome alone, which reduced the number of configuration files.
IoT
Home Assistant entities are used as the common interface for device control. HVAC control rules across the product line are split into a separate contract package, and a gRPC core package is used for communication between services. Putting latency-sensitive calls such as device control on gRPC rather than REST fixes the request and response formats in code, so the contract does not drift even as services are added.
Kiosk / Mobile
A monorepo based on pnpm and Turborepo holds the administrator web app, the kiosk web app, and the React Native Android app together. Because the three apps share the same database package, schema changes are reflected in one go. It includes the payment terminal (VAN) integration module.
Criteria for technology choices
There was one criterion when choosing technology: can the cause be found quickly when a failure occurs on site? A control command starts on the web and travels through the hub to the device, and wherever it breaks along the way, the user only sees "it does not work." So we chose to fix the boundary of each segment in code. Calls between services have their format enforced by gRPC, and API input is validated with Zod so that invalid values do not get further inside. Device control rules are gathered in a separate contract package so that different products follow the same contract. With this in place, the cause of a failure can be narrowed down to "in which segment the format broke."
Problems addressed during implementation
Device response speed that differs by manufacturer. Even for the same kind of light, the time it takes for a command to take effect differs by manufacturer. We let people specify the delay when building a scenario because this difference was hard to absorb in code. Adjusting the value on site is much faster.
Not letting control failures pass silently. A control command can fail at any stage: network, hub, or device. If failures are ignored, the screen shows a device as on while the actual device is off. This is why every control action is recorded through to success or failure, and the device's last communication time is shown alongside.
Payment terminal integration. VAN payments on the kiosk often respond late or disconnect midway. The polling interval, timeout, and retry conditions are set out and maintained in a separate document. For features that connect to hardware, the operating rules have to be settled before the code for them to run reliably.
The gap between the space state and the actual situation. There are cases where the space state recorded in the system and the actual situation on site diverge. If the state is updated only automatically, exceptions are not reflected, and if it is left only to manual updates, updates fall behind. We use sensor values and manual changes together and display the last change time so that the manager can judge how much to trust the value.
6. Project Information
| Item | Details |
|---|---|
| Project name | Development of an energy saving solution (B-Saver / F-Saver) |
| Scope of work | Planning, web, kiosk, and app development, operation |
| Technologies | Next.js, React, TypeScript, Prisma, PostgreSQL, Home Assistant, gRPC, React Native |
Planning a similar project?
Share your requirements and timeline, and we will outline a suitable scope and setup.
Comments 0
Be the first to leave a comment.