
The screen we show when introducing a space energy management system is simple. There is a list of space cards, pressing a card brings up the lighting and air conditioner switches, and the side menu has a graph of this month's electricity usage.
So we often get questions like these. "What actually happens when I press that button?" "How does a sensor value make it to the screen?" "What happens if the internet drops for a moment?"
This article is the answer to those questions. Using B-Saver, the building energy saving solution we developed and operate ourselves, we follow the paths that data takes behind the screen, one by one. Development of B-Saver began in April 2025, and it currently controls more than 200 devices, including lighting, switches and HVAC.
To say it up front, data in this system does not travel along a single path. The path state comes up, the path commands go down, the path automation makes its decisions on, and the path power data comes in on are each separate. Looking at the paths separately makes the architecture much easier to read.
1. Overall Architecture: Four Layers
From bottom to top, the system is divided into four layers.
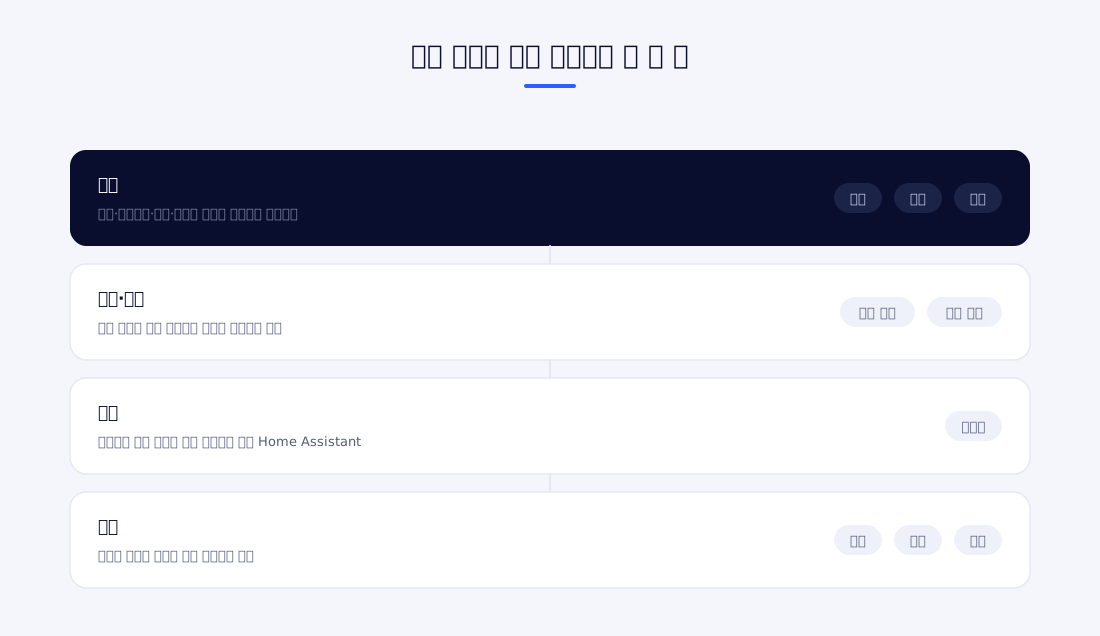
| Layer | Components | Responsibility |
|---|---|---|
| Field | Lighting, switches, air conditioners, door locks, temperature/humidity and occupancy sensors | Physically turn on and off and measure values |
| Hub | Home Assistant installed on site | Brings devices from different manufacturers into the same format |
| Collection and control | Services with a persistent connection to the hub, command queue | Receive and store state changes and deliver commands in order |
| Business | Facility, automation, energy, reservation and notification services, and the dashboard | Handle operational units such as spaces, scenarios, billing and reservations |
Why There Is a Hub
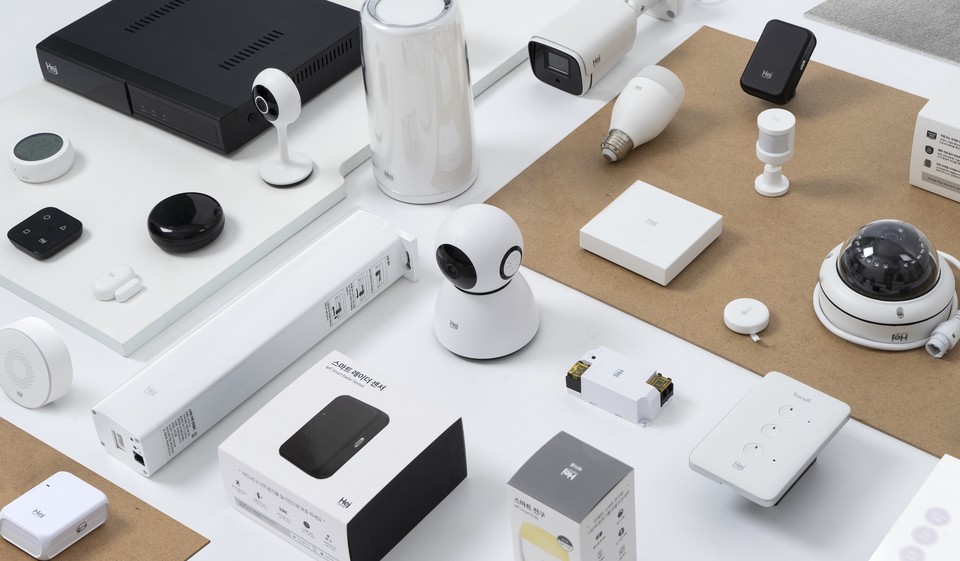
Field devices communicate differently depending on the manufacturer. Lighting is controlled over Zigbee, air conditioners by infrared remote control signals, door locks through the manufacturer's server, and so on. Once the upper system starts handling these differences directly, the code grows every time one more device type is added.
Home Assistant organizes these differences into a single format called an entity. Whether it is a light or an air conditioner, it is expressed as "name, current state, attributes", and control is also sent in the same format: "request this action on this entity". The upper system only needs to know about entities. Even if the lighting manufacturer changes, the dashboard code stays the same.
The Unit Is the Space, Not the Device
What the hub provides is a list of entities. A list of hundreds of entities in a single column is hard to use for operations. That is because the instruction a manager gives is not "turn off light number 12" but "clear up the third-floor meeting room".
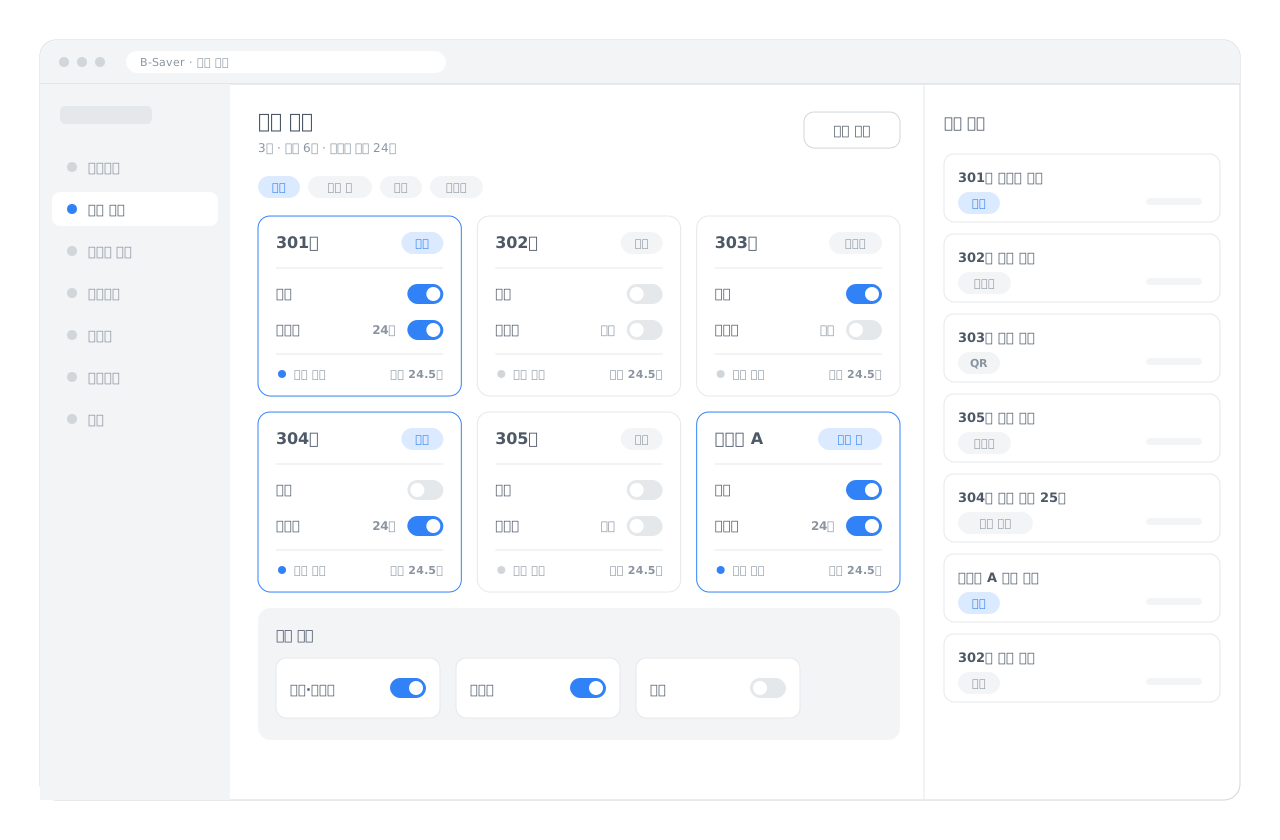
So we first build a hierarchy of buildings, floors and spaces, and then place entities into spaces. When the registration screen loads the entities the hub has, it shows only the controllable types (lighting, switches, HVAC, covers, door locks and so on) and sensors, and anything already registered is left out of the list. The manager only has to pick entities and put them into a space.
A space has a value called its current state attached. This is an operational state such as "checked in" or "cleaning". As we will see later, this value is not only for display on screen; it is also used as a decision condition for automation.
2. The Path State Comes Up
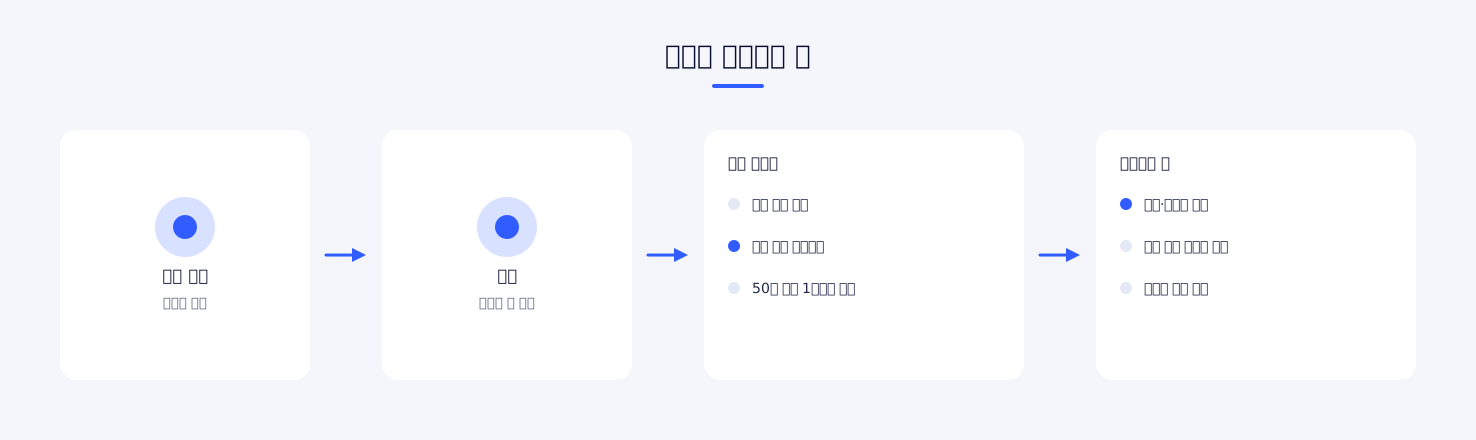
This is the path from a change in the field to its display on screen. Let us take the moment an occupancy sensor detects a person as an example.
One Connection Is Maintained per Customer Hub
The collection service keeps one WebSocket connection open for each registered hub. It does not ask the hub periodically; it keeps the connection open and receives changes.
The list of connection targets is checked again every 60 seconds. When a new customer's hub is registered, a connection is added at the next check, and when a hub's address or credentials change, the connection is re-established. The service does not connect to a hub that has no registered devices at all.
Only Changes Are Picked Out
What the hub sends is the latest value of every entity. The collection service compares each one with the previous value and turns only the entities whose state has changed into events. For most devices only state values such as on and off are compared, but air conditioners are an exception. It is common for the power to stay the same while only the target temperature, fan speed or operating mode changes, so changes in these attributes are watched as well.
The first values received right after connecting have nothing to be compared against, so they are not turned into events. This prevents a flood of "state changed" events from every device each time the service restarts.
Events Are Sent in Batches
If each event were sent as its own storage request, turning off all the lighting in a building at once would produce hundreds of simultaneous requests. So events are sent as one batch when 50 have accumulated or 1 second has passed. The screen update is delayed by up to 1 second, and in exchange the number of requests the server receives drops significantly.
Devices and Sensors Are Stored Differently
- Devices: every time the state changes, one history row is written, and the device's current state, last communication time and online status are updated
- Sensors: the current value is updated, and values that can be converted to numbers are accumulated as time-series measurements. For an occupancy sensor, "detected" is stored as 1 and "not detected" as 0
Values the hub reports as "unavailable" are not stored as measurements. If a period of lost communication were recorded as 0, it could not be told apart from a real 0 on a graph later.
Changes Are Pushed to the Screen
Once storage is complete, the real-time delivery service sends an event to the browsers that are viewing that device or sensor. When a browser receives an event, it waits 0.5 seconds and then re-reads the space summary once. The interval is there so that ten lights turning off in a row do not cause ten re-reads.
We do not rely on the real-time connection alone. While the screen is visible, the summary is re-read once every 30 seconds. Even if an event is lost along the way, the screen is brought back in line with reality within 30 seconds.
When the Connection Drops
When the connection to a hub drops, the service retries after 5 seconds and doubles the interval each time it fails. The interval grows only up to a maximum of 5 minutes. If the on-site internet is down for several hours, retrying every 5 seconds only creates unnecessary load at the moment of recovery.
When first connecting to a hub, the service does not wait for changes; it reads the full state once and stores it. This step is there so that devices that were already on before the connection are reflected on screen.
3. The Path Commands Go Down
Now the opposite direction. This is what happens when a manager turns on an air conditioner from the screen.
Receiving a Request and Executing It Are Separated
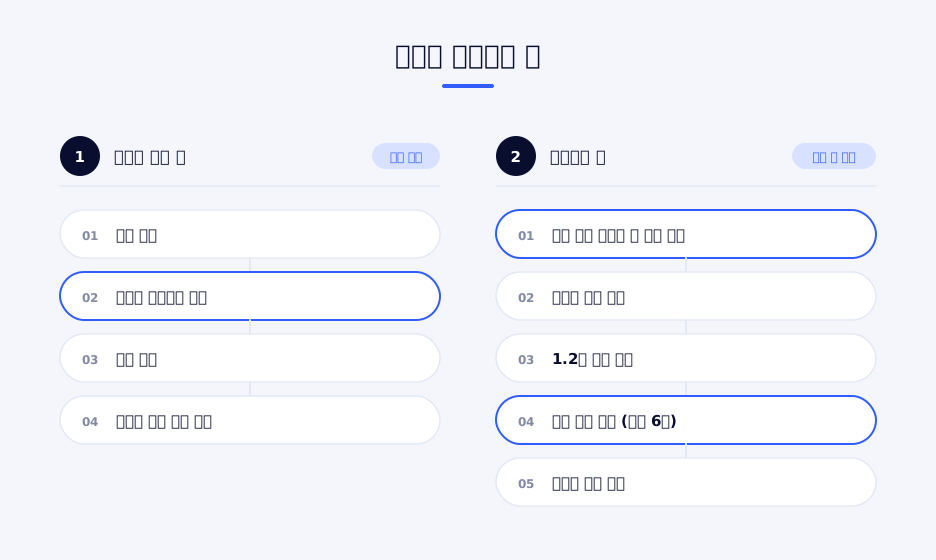
When the button is pressed, the server does not call the hub on the spot. After checking permissions, it puts the command in a queue and responds immediately. As soon as the screen receives the response, it switches the control to the on state.
Execution is handled by a worker that watches the queue. The reason for this split is that hub response time is not consistent. For an air conditioner controlled by infrared, it can take more than 1 second for a command to take effect. If the user's request is held for that time, the screen appears frozen and the user ends up pressing the button several times.
Commands to the Same Device Are Queued in Line
The worker processes several commands concurrently, but it sends only one command at a time to the same device. After sending a command, it allows a settling time of 1.2 seconds before permitting the next one.
This mechanism was added during operation. When "power on" and "temperature 24 degrees" were sent to an infrared air conditioner almost simultaneously, the second signal sometimes overlapped the first and one of the two was ignored. On screen both commands appeared successful, while the actual air conditioner only changed its temperature and did not turn on.
The State Is Checked Again After Execution
The hub responding that it "received the command" is different from the device actually changing. So after sending a command, the worker asks the hub for the device's state again. It checks at 0.5-second intervals for up to 6 seconds, and numeric values are given a tolerance. A target temperature within 0.5 degrees, or a brightness within 1%, is considered applied.
| Step | Criterion |
|---|---|
| Hub call timeout | 10 seconds |
| Retries on call failure | 3 times, with increasing intervals |
| Settling time after a command | 1.2 seconds |
| Confirmation of the change | 0.5-second intervals, up to 6 seconds |
A failed confirmation is not immediately recorded as a failure. If the hub received the command normally, the result is left as success and a warning, "could not confirm the change", is recorded alongside it. Some devices are slow to report their state, so treating every failed confirmation as a failure would mix controls that worked correctly into the failure statistics.
Final confirmation is the job of the path described in section 2. When the device actually changes, the hub sends the state change up, and that value is reflected on screen. If the expected value the screen displayed first differs from the actual value, it is corrected at this point.
Every Command Is Recorded
For each control action, the device, the action, the values before and after, the result and the source are recorded. The source is classified as manual, scenario, schedule, conditional automation or automatic HVAC control. To answer the question "why did the meeting room air conditioner turn on in the middle of the night?", a record is needed not only of who pressed the button but also of which rule ran.
Below is the layout of the space control screen where this path is actually used.
4. The Parts That Run Without Anyone Pressing a Button
Manual control alone does not reduce energy use, because people repeatedly forget to turn things off. There are four paths by which the system creates commands on its own. Whichever path it comes from, a created command goes into the queue from section 3 and is executed by the same procedure.
Scenarios: Several Actions in Sequence
A scenario is a set of device actions bundled in order. Each action can be given a delay of 0 to 60 seconds. The runner puts one action in the queue and waits until it finishes, then rests for the specified time and moves on to the next action.
If one action fails midway, the scenario does not stop; it runs through to the end. The result is recorded as one of three: success, partial success or failure, together with the counts of successes and failures. Skipping the cooling shutdown because one of eight lights did not respond would cost more.
A target state can be attached to a scenario. Running the "start cleaning" scenario changes the space state to "cleaning", and if an end time is specified, at that time the state is released or the next scenario runs in succession.
Schedules: At a Set Time
A schedule runs a scenario according to a time and a repeat rule (every day, weekdays, weekends or specified days of the week). The scheduler looks for items whose run time has arrived every minute and processes them. On the same cycle it also checks the expiry of space states and reservation check-out times.
Conditional Execution: Based on Sensor and Device State
These are rules such as "if the occupancy sensor shows the space empty for 15 minutes, turn off the lighting and cooling". The decision is made in the following order.
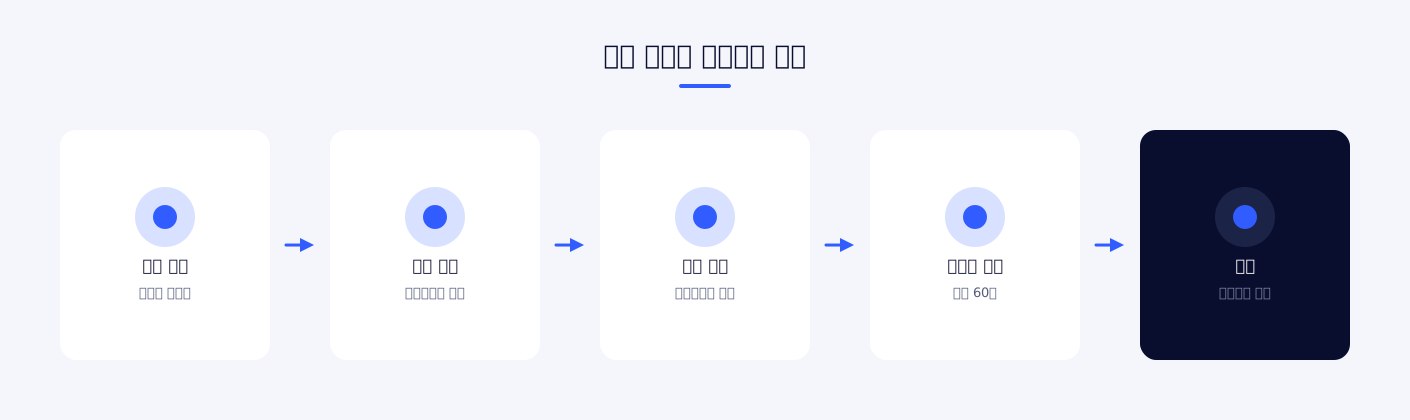
- Only the moment the condition becomes true is caught. The rule reacts only at the moment the condition changes from "not met" to "met". Even if the temperature stays above 28 degrees for an hour, the rule runs only once
- The duration is checked. If a duration is specified, the condition must hold for that time before the rule runs. If the condition is released partway through, the timer is cancelled. This is what distinguishes someone stepping away briefly from someone having left
- The space state is checked. The space state can be set as a condition, as in "do not run in a space that is being cleaned"
- The re-run cooldown is checked. A rule that has run once is configured not to run again for at least 60 seconds and up to 4 hours. This prevents devices from turning on and off repeatedly when a sensor value fluctuates around the threshold
In case an event is missed, there is also a secondary path that re-evaluates conditions every 20 seconds. A device going into a lost-communication state can itself be used as a condition, so fault detection rules such as "notify if the refrigeration equipment does not respond for 5 minutes or more" are built on the same structure.
Reservation Integration: In Step with Check-In and Check-Out
In lodging and shared spaces, the reservation is the most accurate occupancy information. When a check-in scenario and a check-out scenario are assigned to each reservation, the check-in scenario runs and the space state changes to "checked in" the moment check-in is processed at the kiosk or on the manager screen. Once the check-out time has passed, the scheduler automatically processes the check-out and runs the check-out scenario.
So that two paths do not process the same reservation at the same time, only the side that commits the state transition first runs the scenario. Without this ordering, the check-out scenario would run twice and the control history would be duplicated.
Automatic HVAC Control: A Little at a Time, Every 5 Minutes
For air conditioners, adjusting the target temperature saves more than turning them on and off. Automatic HVAC control looks at the state of each space on a 5-minute cycle and adjusts the target temperature.
| Item | Behavior |
|---|---|
| Adjustment step | 1 degree at a time, within the range of 18 to 28 degrees |
| Vacancy decision | If empty for 15 minutes, the space is treated as vacant and switched to relaxed operation or stopped |
| Operating hours | Stopped outside the operating hours set for each day of the week |
| Reservation integration | Heating or cooling starts in advance, from 60 minutes before check-in |
| Manual operation | When a person operates the device directly, automatic control does not intervene for 30 minutes |
The last item is important. If automatic control immediately reverts a person's operation, users end up fighting the system and eventually ask for automatic control to be turned off. Stepping back for a set period after a person has intervened is how automation is kept in place for the long term.
5. The Path Power Data Comes In
So far we have talked about the device side. For this to be energy management, "so how much electricity was used?" has to be inside the same system.
Metering Data Is Pulled from KEPCO
When meter settings are registered for a building, the system integrates the metering data of Korea Electric Power Corporation (KEPCO, 한국전력). Two kinds of data are pulled.
- 15-minute interval usage: values that divide a day into 96 intervals. This is the data for seeing when usage was high
- Monthly charges: the basic charge, energy charge, billed amount, and usage by off-peak, mid-peak and on-peak time period
Collection runs automatically once every morning. At that time it does not pull only the previous day; it pulls the most recent 3 days again. Some intervals of metering data are finalized late, so pulling only one day leaves empty intervals as they are. For the same reason, monthly charges are re-checked for the previous two months.
The period before the system was introduced is filled in by uploading files downloaded from KEPCO. Past data to compare against is needed before any change after introduction can be discussed, so this step is almost always part of initial setup.
How the Numbers on Screen Are Calculated
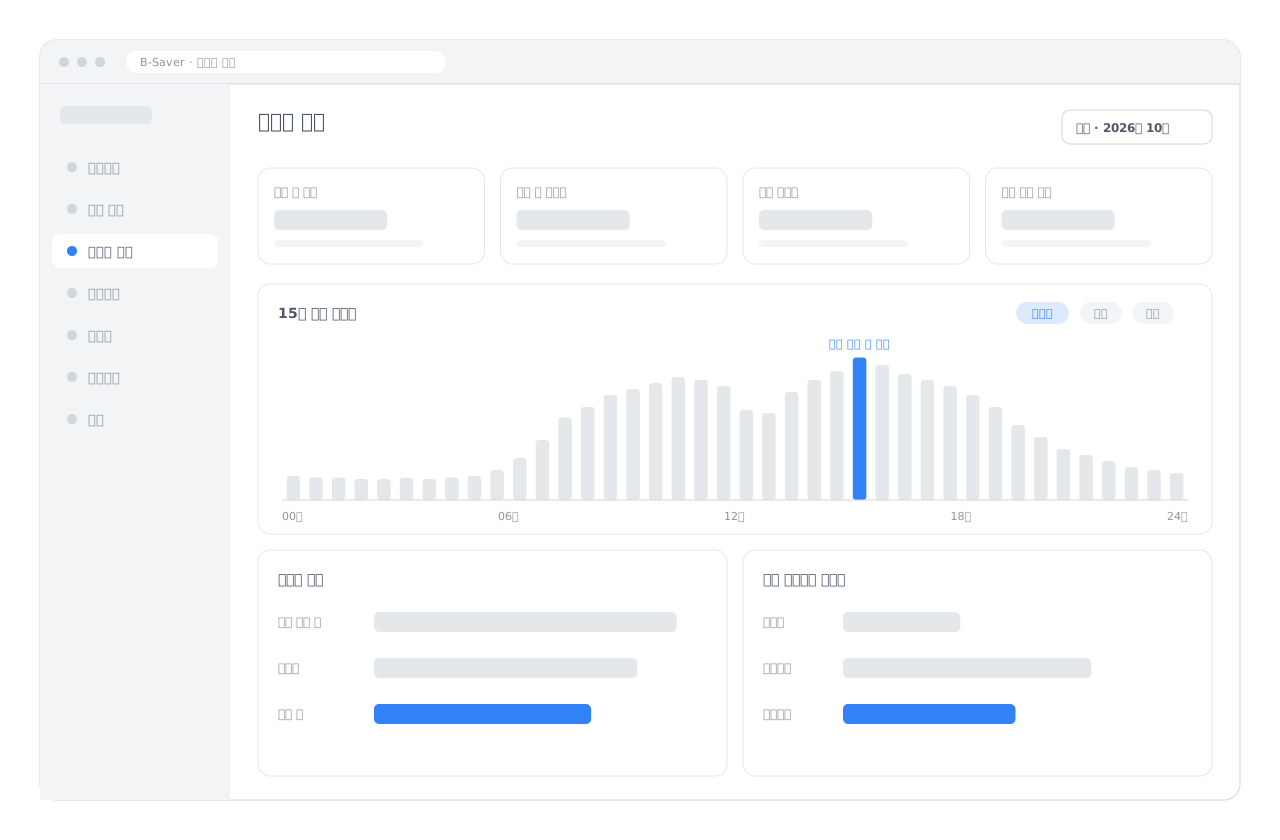
- Current power in use: the usage in the most recent 15-minute interval is multiplied by 4 to convert it to an hourly value
- This month's usage: the sum of off-peak, mid-peak and on-peak usage
- Comparison basis: last month, and the same month last year. HVAC load is seasonal, so a comparison with last month alone is not enough to judge
- Savings amount: the amount by which the bill is lower than last month's billed amount
Viewed Side by Side with Control Records
When power data and control history are in the same system, the shape of the question changes. When looking for "the reason usage spiked last Tuesday afternoon", we open the 15-minute usage for that time period together with the control history for the same period. Because which space's cooling was turned on at what time and by whom is recorded along with the source, the cause is found in the records rather than by estimation.
6. The Path for People Without an Account
The last path is for people who are not managers. Room guests, meeting room users and cleaning staff do not have dashboard accounts. But if they cannot operate devices at all, they go back to wall switches and remote controls, and those operations are not recorded.
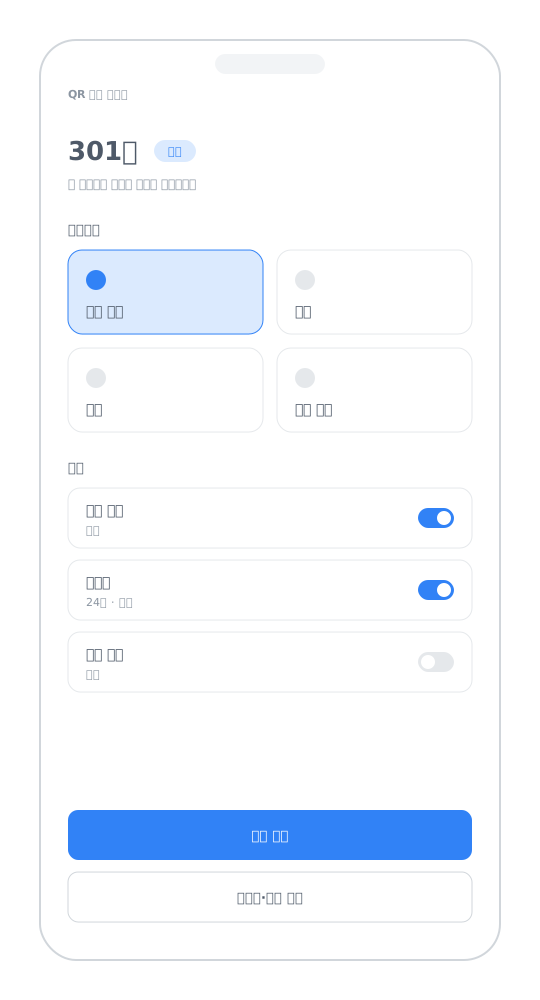
A QR code is issued for each space, and access grants are created separately. An access grant contains a six-digit code, the list of scenarios and devices that can be run, and an expiry time. Even for the same space, a grant for guests and a grant for cleaning staff can be given differently.
- Guests run only lighting and HVAC scenarios
- Cleaning staff run the "start cleaning" scenario and, when the work is finished, press complete to record the time taken
- When lost items or damage are found, they are reported together with a photo
If the code is entered incorrectly 20 times, QR access to that space is locked for 10 minutes. Actions run via QR also go through the queue from section 3, and the control history records which access grant was used to run them.
7. What We Gained from This Architecture
The decisions made for each path, and the reasons for them, are summarized in one table below.
| Decision | Reason |
|---|---|
| Use the hub as the control layer | So the upper system does not need to be changed when the manufacturer changes |
| Receive state over a maintained connection | Periodic polling misses the moment of change and only increases the number of requests |
| Use real-time delivery together with a 30-second re-read | So the screen is not left out of line with reality even if one event is lost |
| Put commands in a queue and respond immediately | So hub response time does not determine how responsive the screen is |
| Send commands to the same device serially | To prevent commands from being ignored because signals overlap |
| Check the actual state again after execution | To distinguish "sent" from "changed" |
| React to a condition only at the moment it changes | So the same rule does not run repeatedly for as long as the condition holds |
| Automatic control steps back after manual operation | So users do not turn the automation off |
| Re-pull metering data with several days of overlap | To fill in intervals that are finalized late |
| Record the source of every control action | To be able to answer later who, or which rule, ran it |
How the Services Were Split
In the beginning, a single web application handled everything. As features grew, we split the services into seven domains: facilities, devices, automation, energy, reservations, accounts and notifications, and gave each domain its own database.
The criterion we held to was not changing the addresses the screen calls or the response formats. The dashboard sends the same requests as before, and the side that receives a request forwards it to the service for that domain. If the screen is modified at the same time as the internal structure of a system in operation is changed, it is hard to tell, when a problem occurs, whether the cause is the structural change or the screen modification.
8. What to Check When Considering Adoption
If you are evaluating a similar system, we recommend asking the vendor the following questions. The more specific the answers, the more the system was built with the operations stage in mind.
- Is device state polled periodically, or received when a change occurs?
- When the on-site internet drops and then recovers, how is the screen brought back in line?
- After a control command is sent, is it checked that it was actually applied?
- How are commands handled when they arrive at the same device in quick succession?
- Does the control history distinguish manual from automatic, and record the rule that ran?
- What happens when a person operates a device directly during automatic control?
- What happens when several actions are run as a bundle and some of them fail?
- In what unit, and from where, is power usage data obtained?
- Can usage from the period before adoption be loaded?
- By what means, and to what extent, can users without an account operate devices?
Closing
In a space energy management system, the screen is the smallest part. Receiving state without missing it, confirming that commands were actually applied, keeping automation from clashing with people, and filling in the empty intervals of power data all sit behind the screen.
Only when these four are in place can the sentence "turning off the air conditioner reduced the electricity bill by this much" be stated from records. With only one of control and metering, savings remain an estimate.
Through developing and operating B-Saver ourselves, we have worked on device control and power data integration for buildings, lodging and shared spaces. If you are preparing to add space-level control to existing equipment or to connect it with power data, please feel free to contact us.
Related Reading
- The order in which to reduce a building's electricity bill: savings do not begin without measurement
- Why is the meeting room air conditioner always on? Designing occupancy-based space control
- What it means to operate an IoT system installed in the field: disconnection, state mismatch and remote management